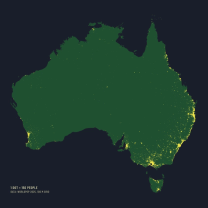
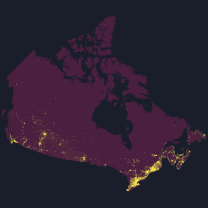
Where a Country Lives
Data Story · Dot-Density Map
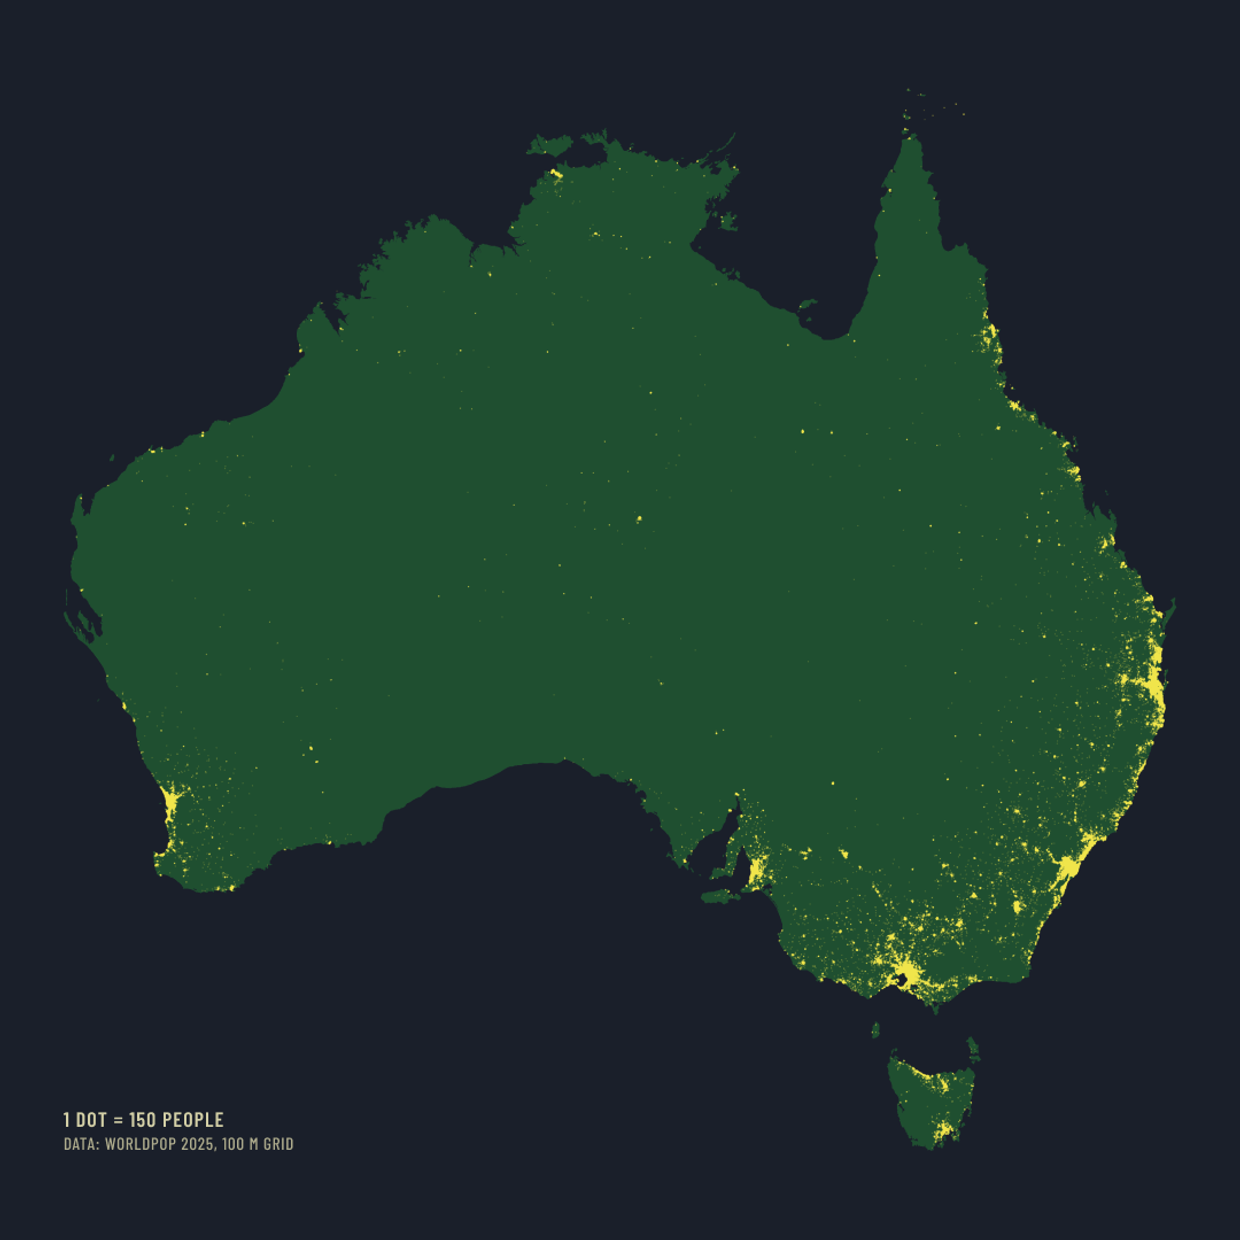
One question, asked of one country at a time: where do its people actually live?
Each entry takes one country and draws every person in it as a dot, one dot for every 150 people, on the same dark ground with the same key. The title is the finding in plain words. Nothing else changes between countries, so the maps can be read against each other.
The dots come from a single global population grid, and the grid total is checked against the country’s own official count before any map is drawn. When a repeated number turns out to be wrong, the entry says so and gives the real one.
The entries so far are listed below, newest first.