When Toronto Has to Go
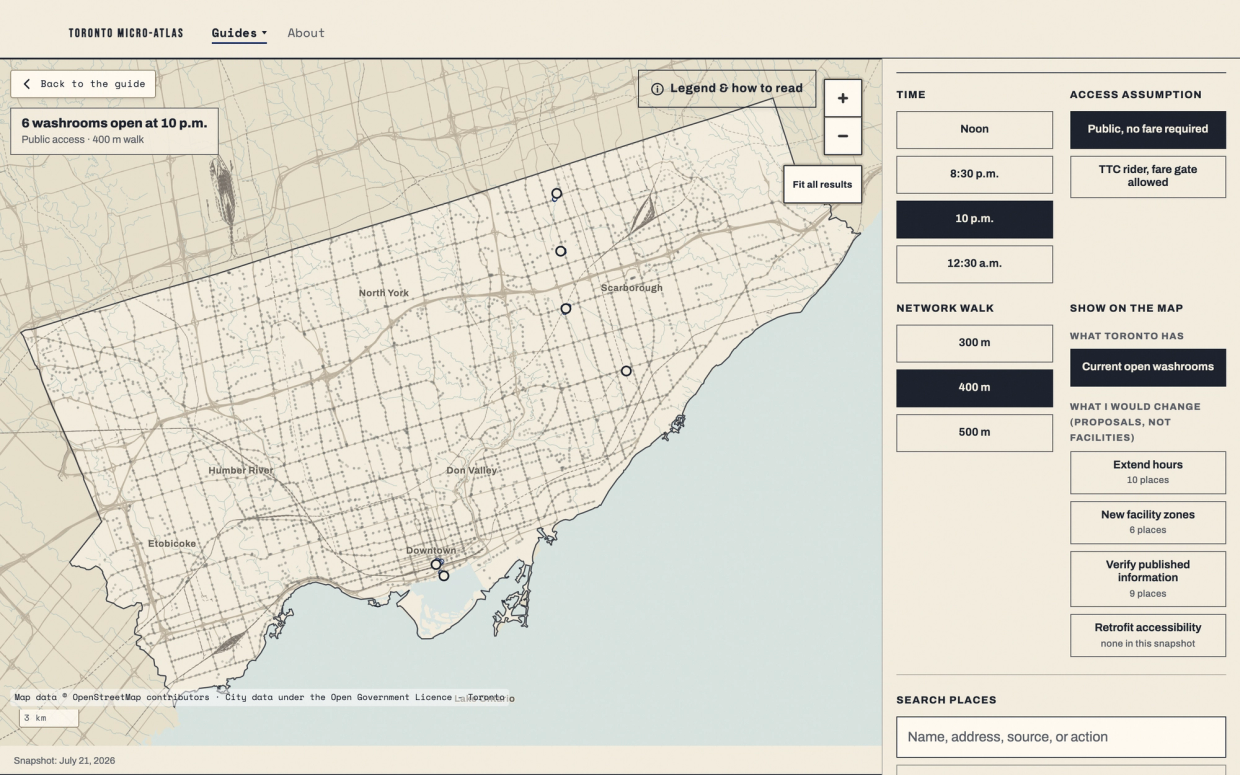
Turning fragmented civic records into a public map of Toronto's after-hours washroom gap.
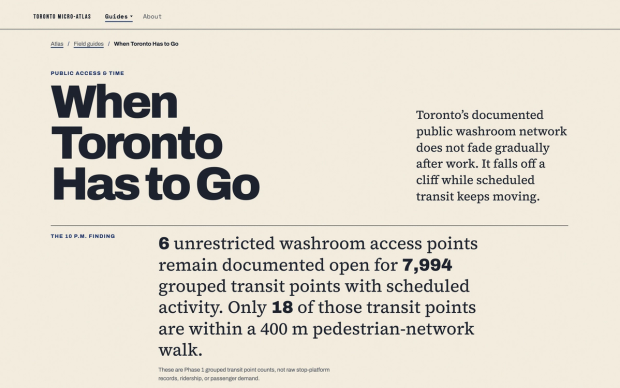
Toronto publishes washroom records and transit schedules, but the records do not show how documented public access changes while scheduled transit continues. A facility can exist and still be unavailable when someone needs it.
Independent project: research, data modelling, spatial analysis, cartographic design, editorial writing, interaction design, and frontend development.
The public problem
At 10 p.m., six unrestricted washroom access points remain documented open while 7,994 grouped transit points still have scheduled activity. Only 18 are within a 400 metre walk along the pedestrian network.
These are scheduled-service records, not ridership or passenger demand. The finding describes the gap between documented transit activity and documented public washroom access.
The translation problem
The source records use different formats, access conditions, operating-hour conventions, and counting grains. I preserved unknown hours, closures, fare-paid access, accessibility uncertainty, and the distinction between co-located access points and individual facility records.
Walking coverage follows the pedestrian network instead of straight-line circles. Fare-gate washrooms stay separate from unrestricted public coverage. Every result links back to its source.
Two connected surfaces
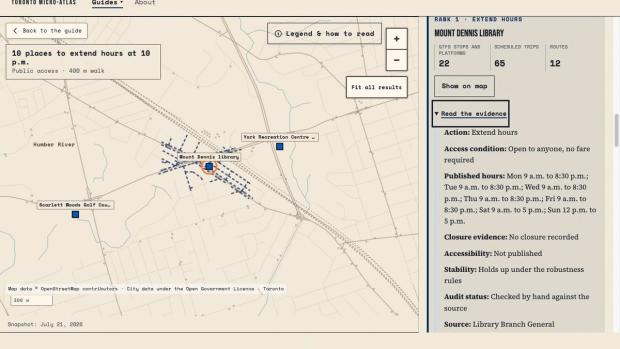
I built an editorial guide to explain the finding and a full map for testing time, fare access, walking distance, and intervention type. The URL records the selected state, so a specific reading can be shared and checked.
The guide carries the argument and its limits. The map carries the exploration, ranked results, evidence disclosures, and source links. Each surface has one job, and they link to each other.
From proof to proposals
The analysis reduced 843 deduplicated candidates to 56 that survived the robustness rules. I reviewed 34 by hand against the map and source records. Twenty-five evidence-backed opportunities were published: 10 places to extend hours, six new facility zones, and nine records that need verification.
Recommendations publish only after the robustness checks and manual review. If that gate fails, the proof remains public and the recommendations are withheld.
What the work makes possible
A civic, editorial, environmental, or public-space team can see how fragmented operational records become a dated public argument, an explorable map, and a traceable shortlist for further investigation.
The product does not claim that an intervention has been approved or that a mapped opportunity is ready to build. It makes the evidence legible enough to decide what deserves a closer look next.
Data snapshot: July 21, 2026. Sources: City of Toronto Open Data and TTC scheduled service under the Open Government Licence - Toronto. Basemap data © OpenStreetMap contributors.