Out of the Sun
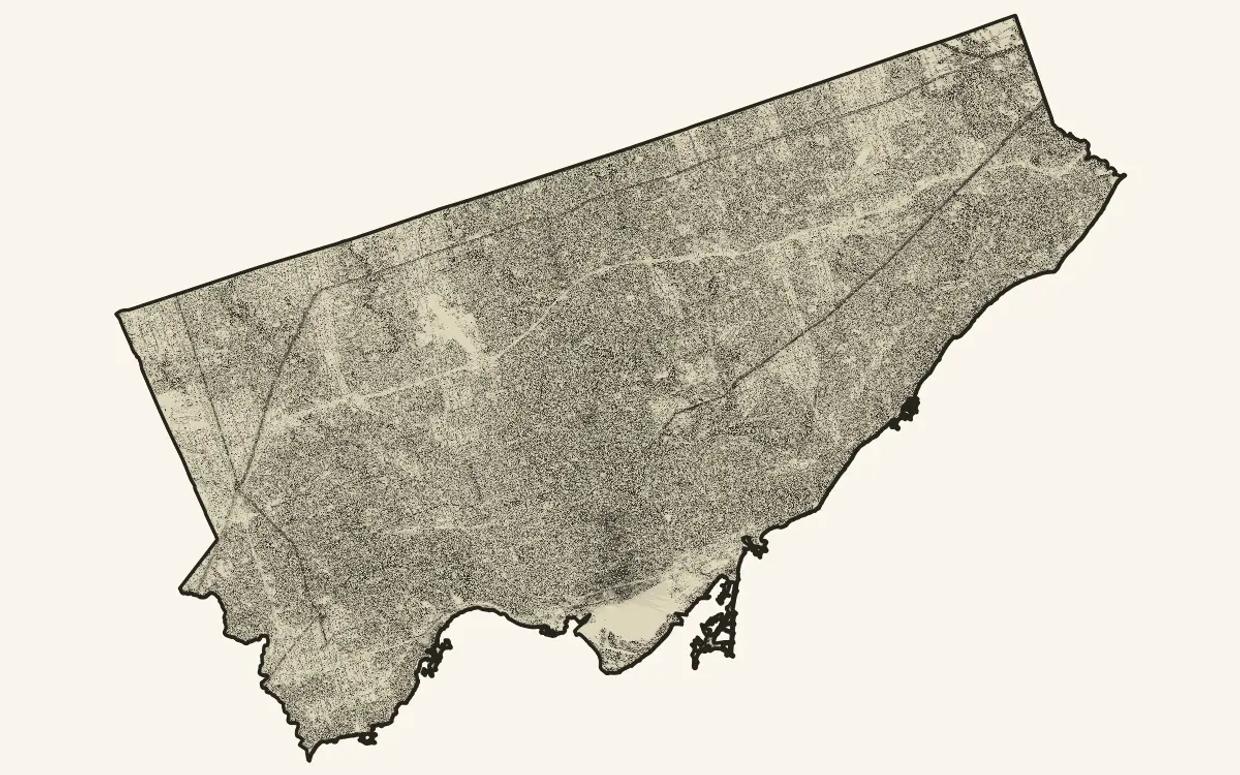
Mapping where Toronto has shade hour by hour, and where sampled transit stops have none.
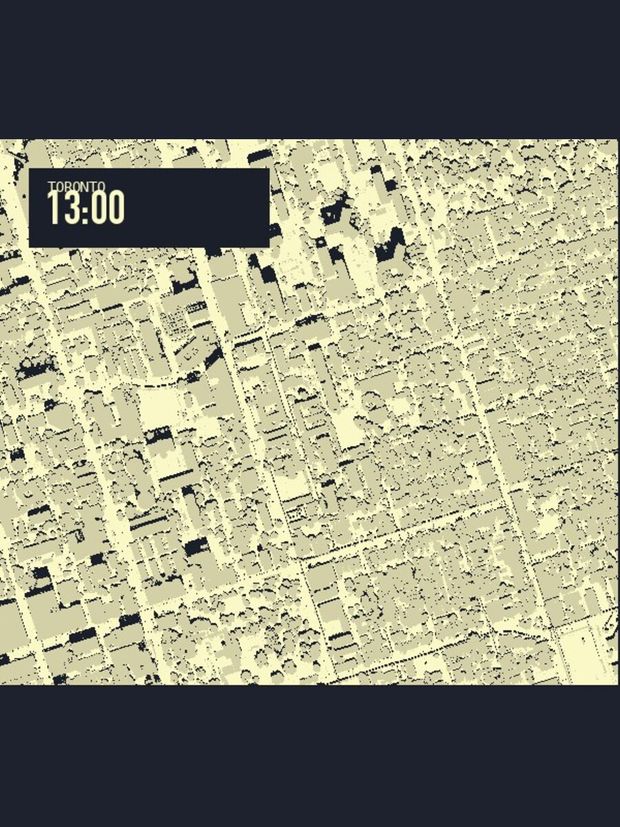
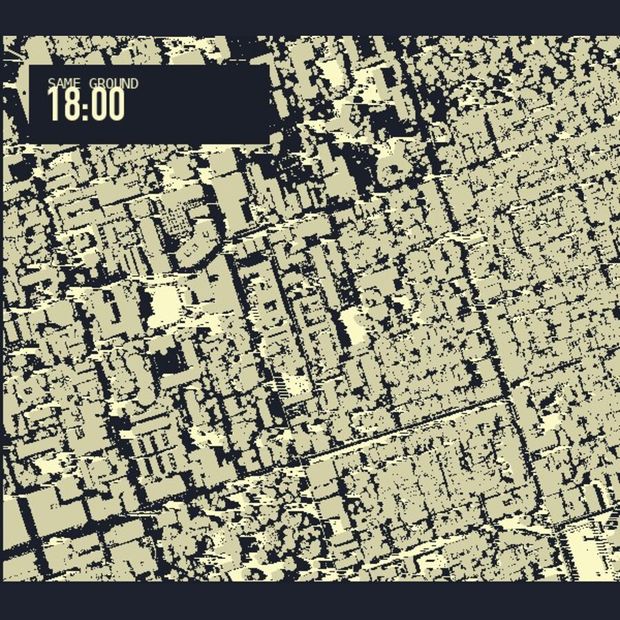
Shade is easy to feel and difficult to map honestly. A building, tree crown, shelter roof, or change in hour can alter what reaches the ground. Out of the Sun models that changing surface across Toronto and gives the map one practical job: look up a street you walk, or a stop where you wait.
Independent project: research direction, geospatial modelling, data pipeline, cartographic design, editorial writing, interaction design, frontend development, and evidence review.
The model
The guide combines 2018 land cover with 2023 lidar on a 2 metre grid. Fifteen hourly frames describe one modelled day. Every measured result is paired with a corrected surface that accounts for tree canopy, because a leaf-off lidar flight cannot stand in for a summer street by itself.
The two surfaces stay visible together. The map, figures, and copy do not collapse that uncertainty into one cleaner-looking number. The guide maps shade, not temperature, and it does not claim that a modelled pixel describes current conditions on the ground.
The map has a task
A reader can search a street, move through the day, compare measured and corrected shade, and inspect the hourly profile at one point. The full map has its own address, so the guide can carry the argument while the map carries the lookup.
The finding that survived review
Of the 6,079 transit-stop coordinates that landed on sampled ground, 46 recorded no usable modelled shade on either surface.
The other 2,353 published stop coordinates are unmeasured and excluded from both sides. A stop coordinate is one sampled point, not a complete platform, shelter, or every place a rider might wait. The result is a dated model output, not a current inventory of unshaded transit stops.
That boundary is the case study. An earlier version counted roof and canopy pixels as if they were ground and produced a much larger headline. Building a browsable set exposed the error. The pipeline, proof file, public data, article copy, metadata, and browser checks now agree on the smaller measured universe.
What this proves
For an environmental, civic, or public-space team, this shows how I handle a spatial model whose limitations matter as much as its output. I can build the instrument, translate it into a public tool, find where a plausible result is wrong, and narrow the claim until the evidence can carry it.
Read the guide or open the full map at torontomicroatlas.com.