#30DayMapChallenge

November 2026
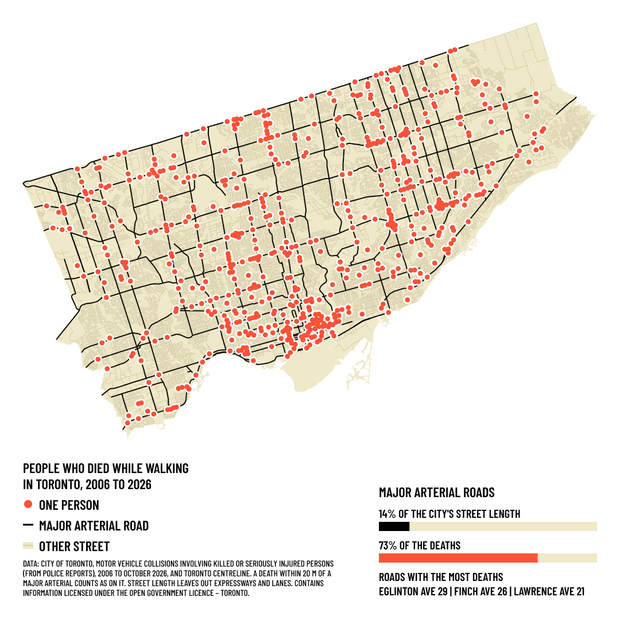
A dot map of Toronto with 606 red dots, one for each person who died while walking between January 2006 and October 2026. Most of the dots sit on the black lines of the major arterial roads, while the faint side streets between them stay mostly empty. Two bars show that major arterials make up 14% of the city's street length and 73% of the deaths, and a line beneath names the roads with the most deaths: Eglinton Avenue (29), Finch Avenue (26) and Lawrence Avenue (21).
01-11-2026 | Points
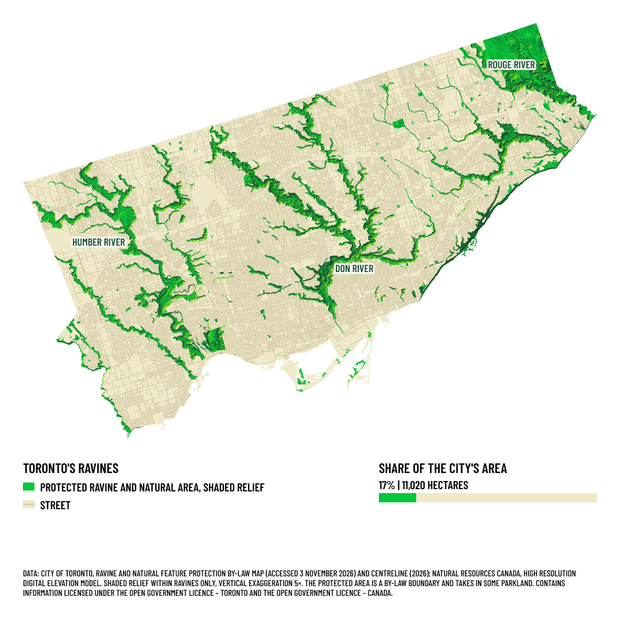
A map of Toronto drawn flat in pale cream with its full street grid, except for the ravines, which are green and shaded to show the valley slopes, so they look carved into the city. The valleys of the Humber, Don and Rouge rivers branch across the map, and the street grid stops at every ravine edge. A bar shows protected ravine and natural area as 17% of the city's area, 11,020 hectares.
03-11-2026 | Polygons
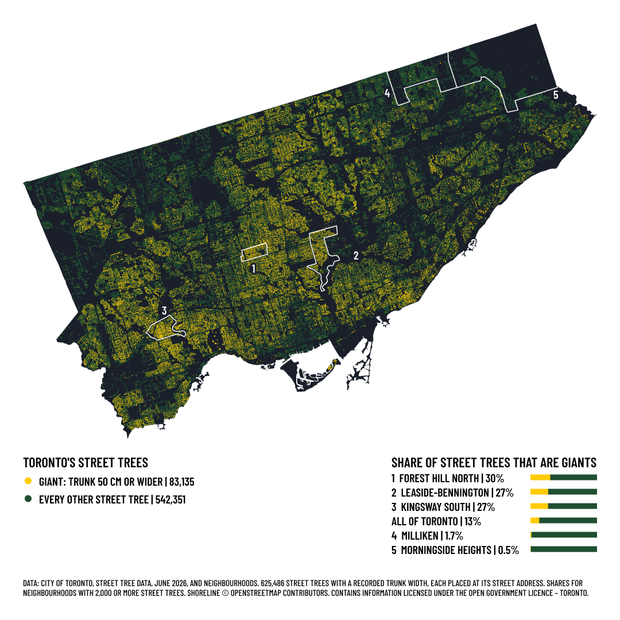
A map of Toronto drawn with 625,486 street trees as small dots on a dark ground, so the street pattern shows and the ravines appear as dark gaps. The 83,135 giants, trees with trunks 50 cm or wider, are yellow and gather thickly in central, western and east-end neighbourhoods, while the far north-west, the north-east and downtown stay darker. Five neighbourhoods are outlined in white and numbered 1 to 5. A list with bars, numbered to match, gives the share of street trees that are giants: Forest Hill North 30%, Leaside-Bennington 27%, Kingsway South 27%, all of Toronto 13%, Milliken 1.7%, Morningside Heights 0.5%.
04-11-2026 | Clusters
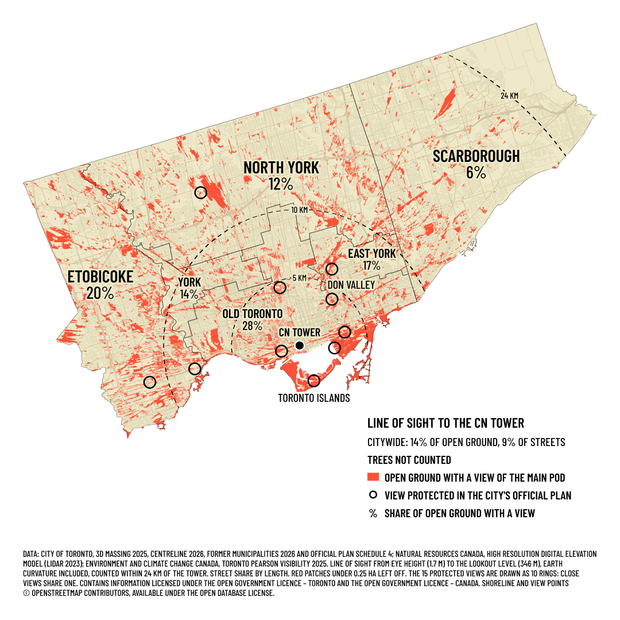
A map of Toronto in cream, with a faint street grid, and red patches marking open ground where a person standing at eye height can see the CN Tower's main pod, about 14% of the city's open ground. The red is densest along the waterfront, on the Toronto Islands, in the Don Valley and along the rail corridors, and long streaks point back toward the tower, a black dot downtown. Dashed rings mark 5, 10 and 24 km from the tower, and no red appears past 24 km in the far north-east corner. Each former municipality is labelled with the share of its open ground that has a view: Old Toronto 28%, Etobicoke 20%, East York 17%, York 14%, North York 12%, Scarborough 6%. Black circles mark the views protected in the City's Official Plan. The key notes that trees are not counted.
05-11-2026 | Senses: Sight
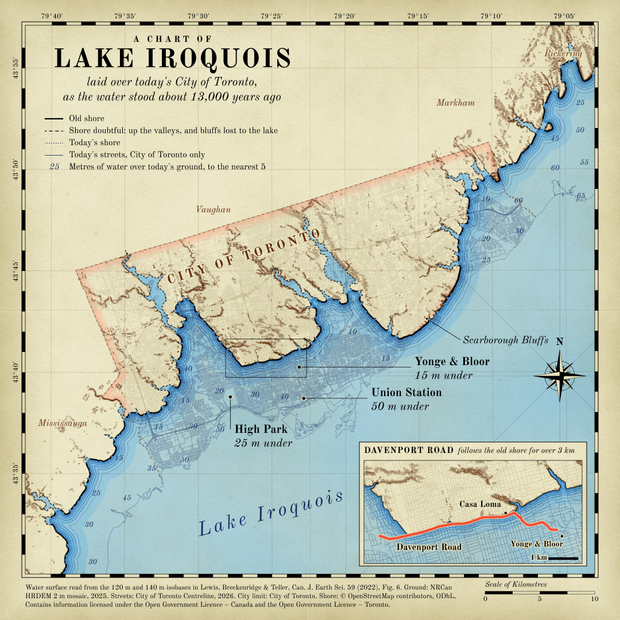
A map styled as an antique nautical chart of Toronto, with the ancient Lake Iroquois drawn over the modern city. Cream land with brown hill shading sits north of a heavy black shoreline. Blue water covers downtown, with today's streets showing faintly beneath it. Labels read Union Station, 50 m under; Yonge and Bloor, 15 m under; High Park, 25 m under. An inset plan shows Davenport Road in red following the old shore below Casa Loma.
06-11-2026 | Vintage
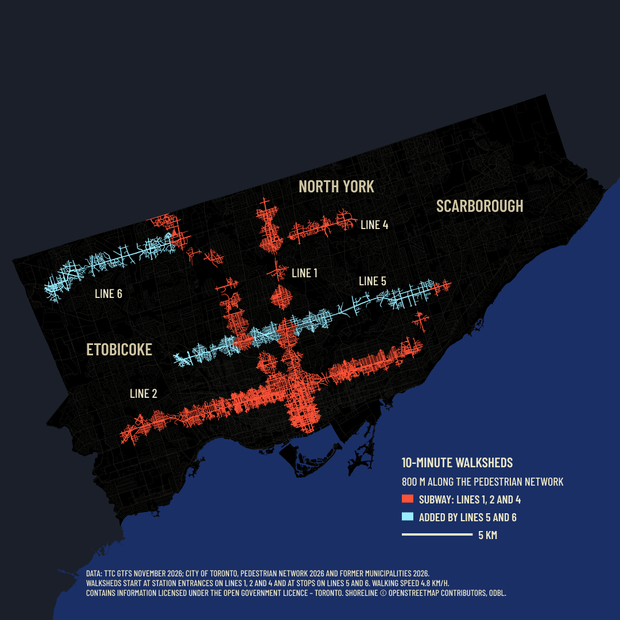
A map of Toronto showing the streets within a 10-minute walk of a rapid transit station. Red subway walks form a dense cross downtown, along Bloor-Danforth and Yonge-University, with smaller patches to the north and along Sheppard. Light blue walks run along Eglinton and Finch West. Most of Etobicoke and North York and nearly all of Scarborough stay black.
07-11-2026 | 10 minute map
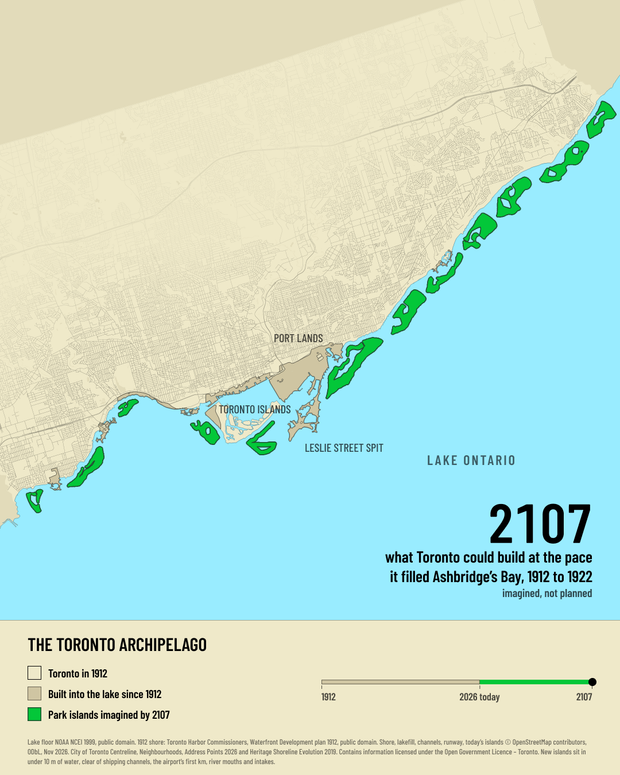
An imagined map of Toronto's lakeshore, north up, from Long Branch in the west to the Rouge River in the east, with a cream band of text below it. The city is cream with a faint street grid and the lake light blue. A chain of 12 bright green park islands with dark green outlines and lagoons runs along most of the shore; these islands are imagined. Land Toronto has built into the lake since 1912 is sand-coloured: the Port Lands, the Leslie Street Spit, the central waterfront, the western part of the Toronto Islands where the airport is, Sunnyside and the lakefill parks. The Port Lands, the Toronto Islands, the Leslie Street Spit and Lake Ontario are labelled. In the lake at the lower right, large text reads 2107, what Toronto could build at the pace it filled Ashbridge's Bay, 1912 to 1922, imagined, not planned. The band below is titled The Toronto Archipelago and has a key with colour swatches, in time order: cream, Toronto in 1912; sand, built into the lake since 1912; green, park islands imagined by 2107. Beside the key a timeline runs from 1912 to 2107, sand to 2026 and green after.
08-11-2026 | Utopia
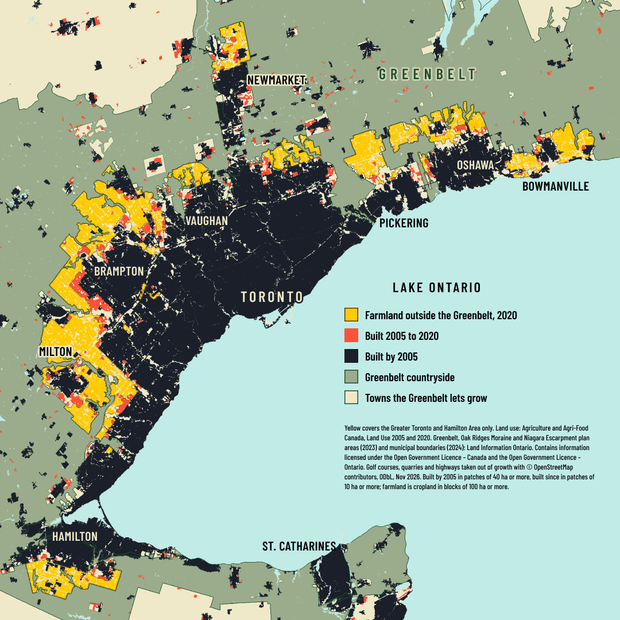
A map of the Greater Toronto and Hamilton Area, from Hamilton to Bowmanville, with St. Catharines across the lake. The built-up city is a dark mass along the Lake Ontario shore, and the Greenbelt around it is shaded sage green. Farmland outside the Greenbelt is yellow: a wide band around Brampton and Milton, pockets north of Vaughan and around Newmarket, blocks north of Pickering, Oshawa and Bowmanville, and a patch south of Hamilton. Red patches of growth since 2005 sit along the edge of the dark city.
09-11-2026 | Urban-rural
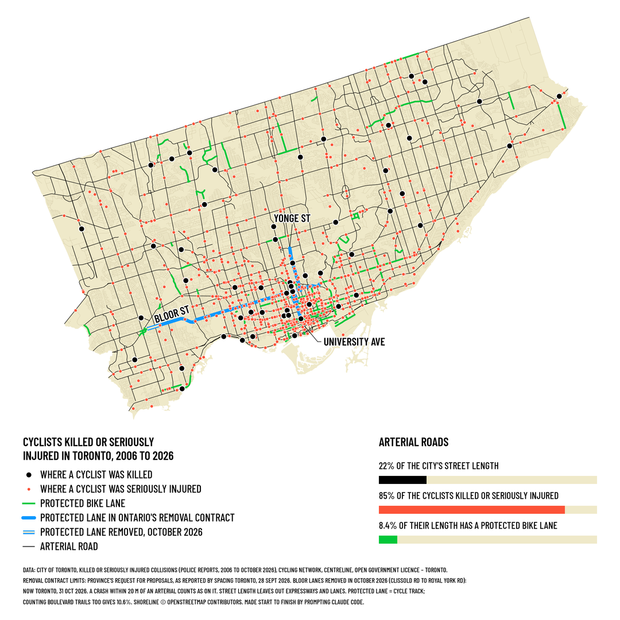
A map of Toronto with cream land and thin black arterial roads. About 850 small red dots mark crashes since 2006 where a cyclist was seriously injured; they line the arterials and crowd downtown. 55 larger black dots mark where a cyclist was killed. Short green lines show the protected bike lanes. Thick blue lines show the protected lanes in Ontario's removal contract: Bloor Street across the west end to downtown, Yonge Street north of Bloor, and University Avenue. A short hollow blue stretch at the west end of Bloor marks the part removed in October 2026. Below the map, a key and three bars: arterial roads are 22% of the city's street length, carry 85% of the cyclists killed or seriously injured, and 8.4% of their length has a protected bike lane.
10-11-2026 | Prompting only
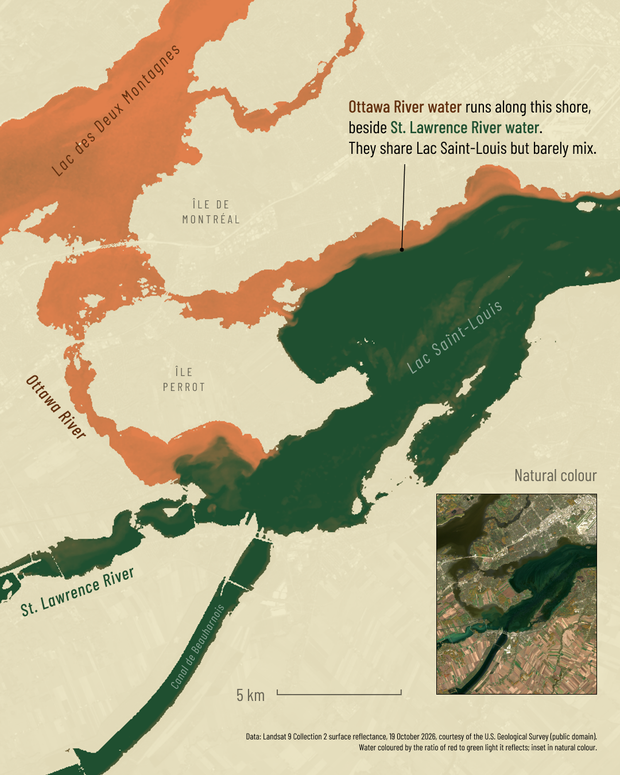
A satellite map of Lac Saint-Louis at the west end of Montréal, with Ottawa River water coloured orange-brown and St. Lawrence River water dark green. Along the Montréal shore an orange-brown band runs beside the green with a sharp edge, and a note says the two share Lac Saint-Louis but barely mix. Lac des Deux Montagnes, the Canal de Beauharnois, Île de Montréal and Île Perrot are labelled, and an inset shows the same view in natural colour.
13-11-2026 | Interactions

#30DayMapChallenge runs every November. Each day has a theme, such as points, lines, raster or pen and paper, and anyone can join with any tools and data.

I'm making the days I have a real idea for. A few are finished pieces; most are sketches with a two-hour limit, posted as they stand when time runs out.